“We’ve got to pause and ask ourselves: How much clean air do we need?”
Lee Iacocca
Clean air
Feeling drowsy ? Got a headache ? Hard to concentrate ?
No worries. Check the CO2 levels in the office. If they are on the high side, go open a window and breathe some fresh air - or yell at the janitor in order to get him/her to fix the air conditioning.
Severe irritation of the nose and throat ? Fluid in the lungs ? Shortness of breath ? Tightness in the chest ? Nauseaus ? Drowsy ? Sudden heart attack ? Damaged DNA ? Failing organs ? Recently deceased…?
Time to worry. These are some of the symptoms and effects of sulphur dioxide or carbon monoxide poisoning.
Carbon monoxide is a colorless, odorless and tasteless gas that is produced during incomplete combustion, typically of natural gas, gasoline, kerosene, wood, oil or coal. Smokers are especially sensitive, since they already get a daily dose of CO, that binds to the hemoglobin in their blood, permanently preventing the molecule from transporting oxygen.
The burning of fossil fuels is also a major sulphur dioxide source. This is also a colorless gas - that, if inhaled, will form sulphuric acid in the lungs - which is bad.
These are toxic gases, but since they are easily formed in common processes, regulatory government agencies have defined exposure limits for them. In Norway, the limits in industrial settings are (8 hours exposure):
-
Sulphur Dioxide: 2 mg/m3
-
Carbon monoxide: 29 mg/m3
These exposure limits can be converted into PPM (parts per million) limits by using the following formula (atmospheric pressure, 25 degrees C) :
PPM = 24,45/(molecular weight for the given gas) x (mg/m3 concentration)
We now know what to measure. Now, we just need sensors.
All electrochemical sensors are analog in nature, so you will require an ADC in order to convert the analog output to a digital one. For this application I have chosen sensors from SPEC Sensors, since they also provide a bridge between the analog signal and an UART, enabling you to get a simple digital output from them. Interfacing this to an EE-02 module requires only three wires, but I decided to make a simple PCB, because it would increase mechanical stability and also be easier to mount inside an enclosure.
The joys of power profiling
There are no wall sockets where these devices are going to be deployed. The devices will have to be battery powered and the batteries will have to be able to provide power for the sensors for a relatively long time (several months). Furthermore, the sensors will be deployed in a hazardous environment in an industrial facility that is not accessible without using safety equipment. Relying on frequent battery changes or rechargable batteries is not an option.
We also have size constraints, since it should be relatively easy to deploy the sensors. After considering several alternatives, we decided on using alkaline D-cells. These are relatively cheap and they have much higher energy density than rechargeable batteries. The downsize is that they are big.
We now have a power budget. It is of the essence that we minimize the power consumption, such that we can maximize battery life. One of the difficult parts in making battery powered IoT devices is power profiling and minimizing the power budget.
A typical industrial D-cell will have a capacity of 16000+mAH. Connecting two cells in series will result in a 3V/16000mAH battery pack.
Reading the sensor datasheet, we find that it will consume 1mW for 1 minute triggered samples and 12mW in continous sampling mode. We’re driving the sensor directly from a 3V battery pack. The absolute minimum voltage is 2.6V. Ideally, we should have used a boost regulator with a really low quiescent current, but since the focus here is on comparing data quality of off the shelf sensor modules with data from high end instrumentation, we can live with the nonlinear characteristics of the discharge curve for alkaline batteries. When the battery voltage drops below 2.6 volts - we’ll know.
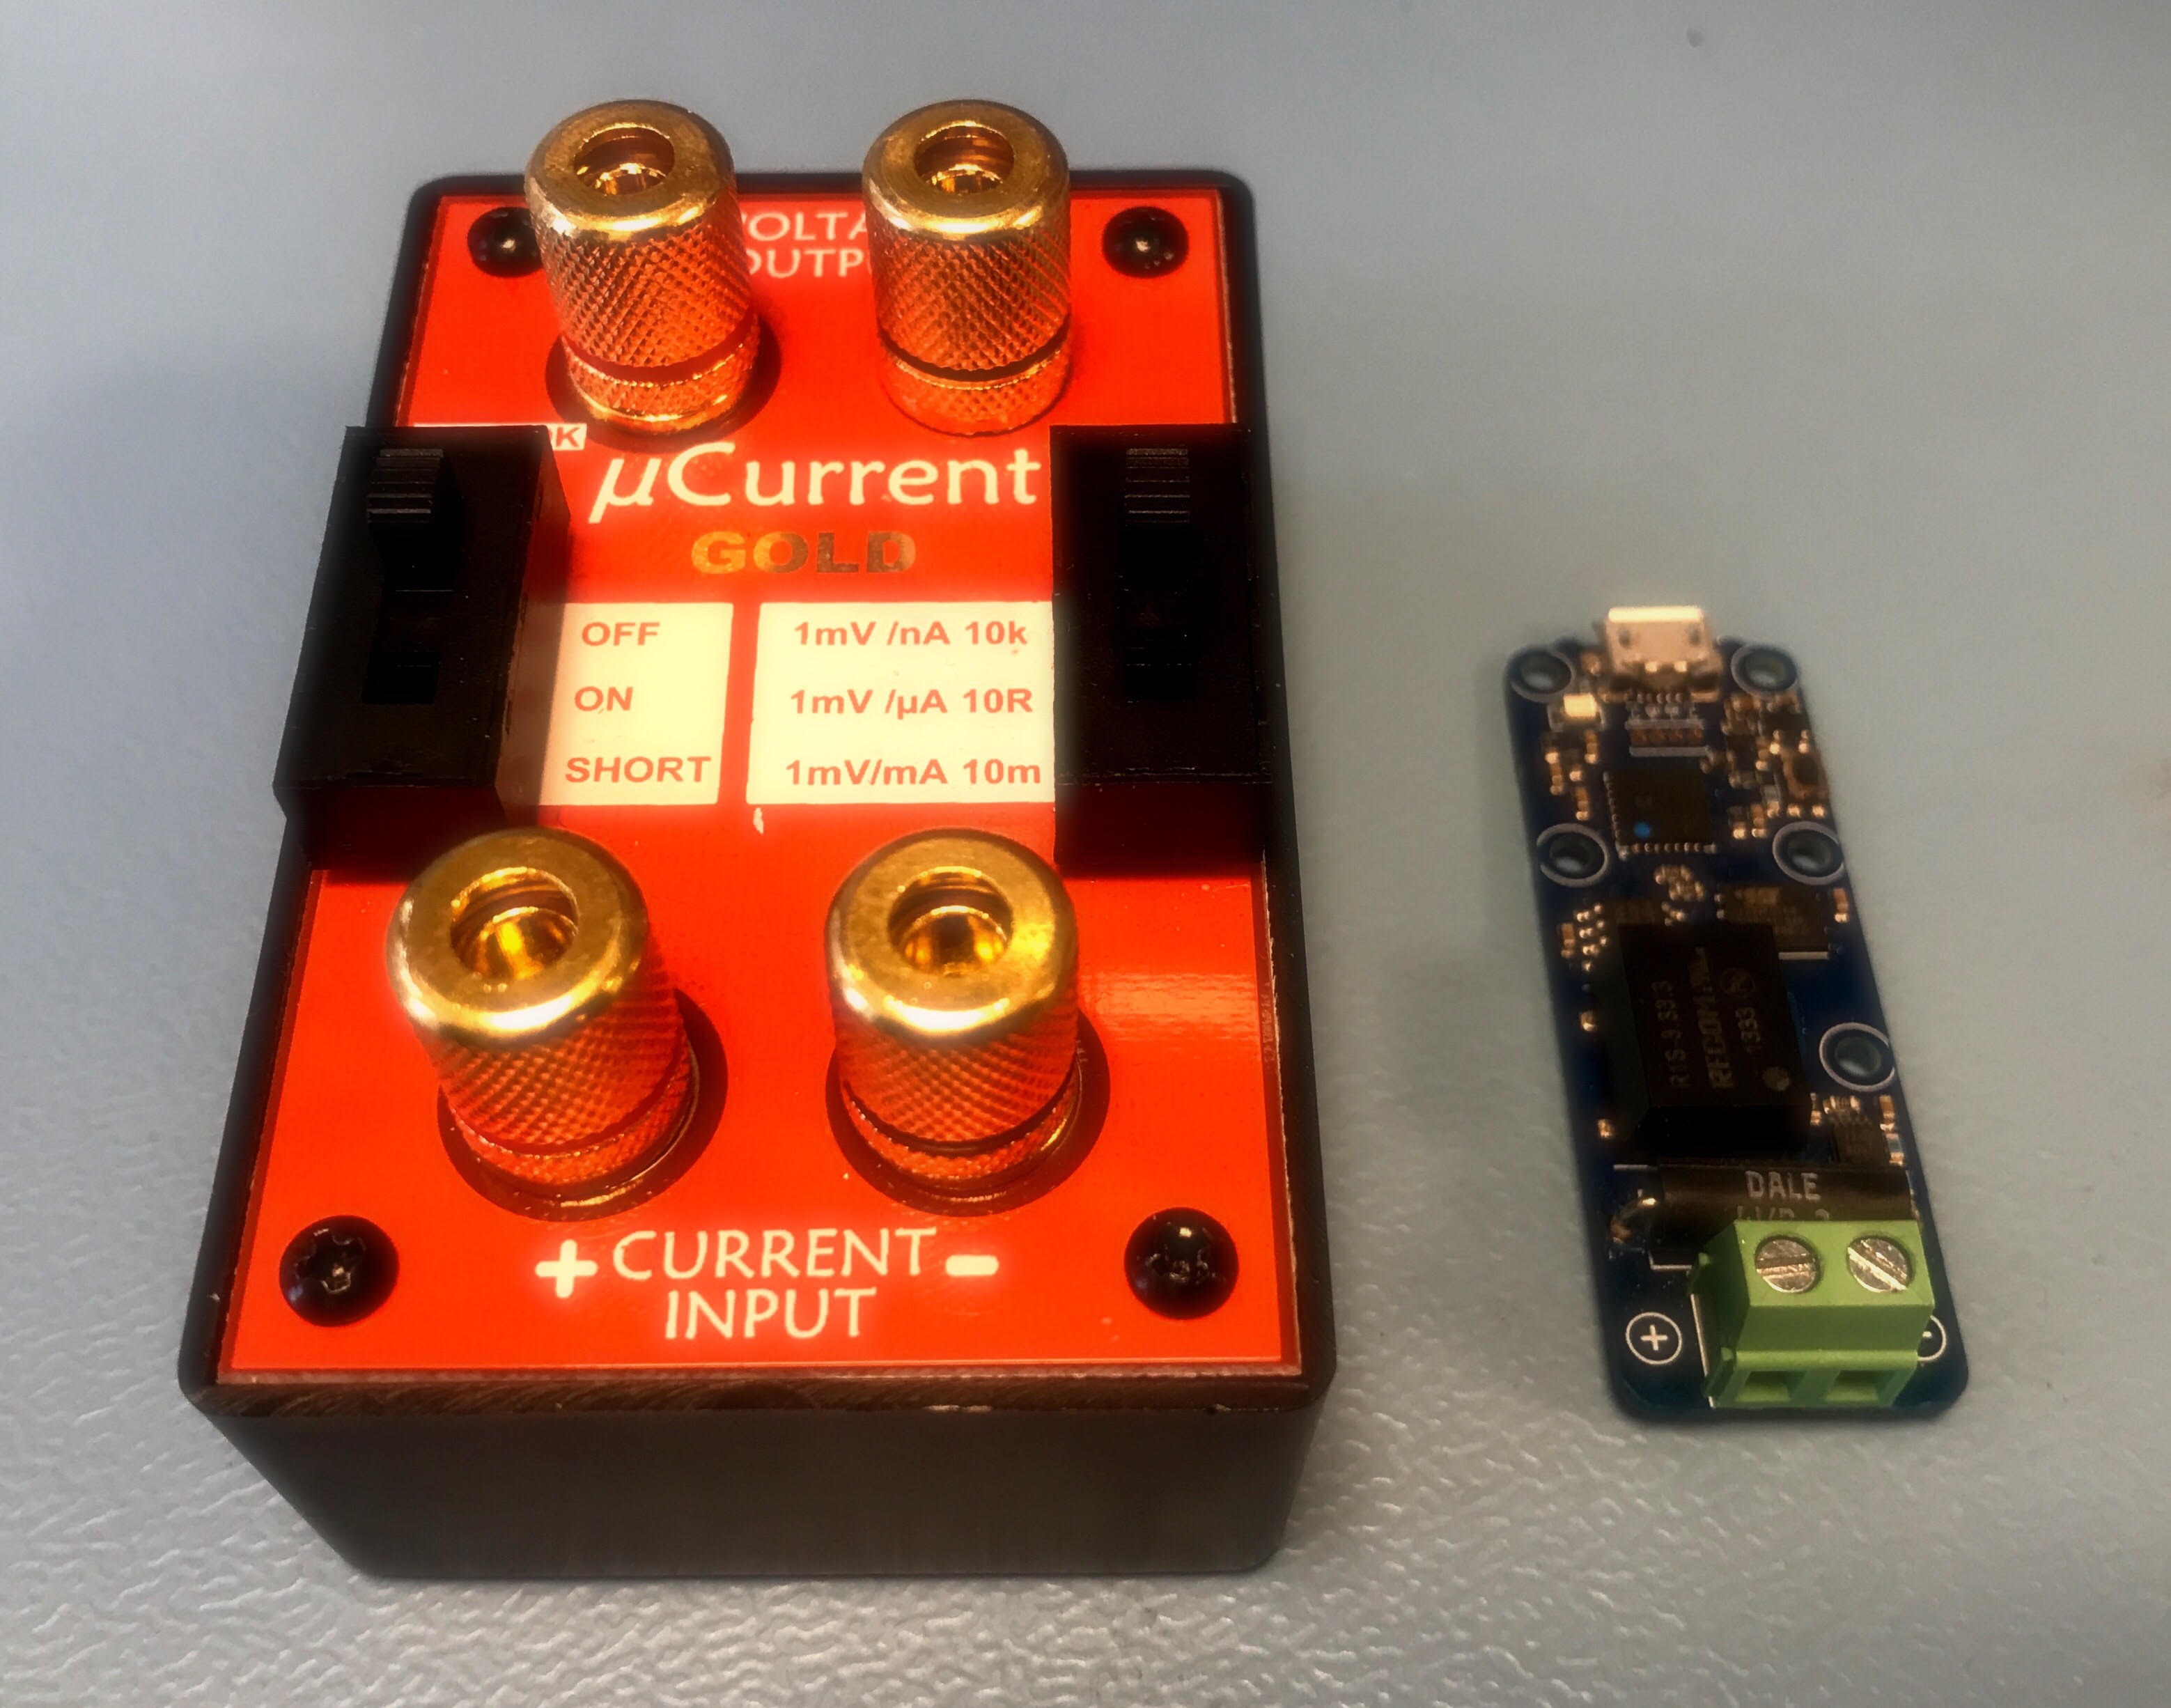
I may be “doing it wrong”, but I could not get the sensor’s current consumption below 4mA. It should be in the ballpark 0.3mA when doing discrete samples, but it consumed just as much current in triggered sample mode as it did in continous mode. In order to verify this, I ran the module without the sensor in a setup with a uCurrent Gold and a Yocto-Amp. The precision of the Yocto-Amp is only 2mA. You can read about precision of the uCurrent Gold on EEVBlog.
Both registered 0 mA when the EE02 LoRa module was in sleep mode (a few microamps is still dripping through). Both registered expected current consumption during transmit and both registered consistently 4mA when the EE02 was idling, regardless of the sensor being in triggered mode or in continous mode.
Fun fact: During the power profiling, I discovered a bug in the MyNewt implementation of the SX1276 radio driver. It doesn’t initialize the SX1276 correctly, so it won’t be in sleep mode until after the first time it transmits a LoRa payload after boot. I can live with that, but it should probably be fixed.
Fortunately, the D-cells will still be able to power the sensors for close to 6 months, sampling at 1 minute intervals and transmitting in 5 minute intervals.
Enclosures
The sensors were going to be deployed at an industrial incineration facility. There will be dust. There will be smoke. I borged HEPA filters from a Miele vacuum cleaner (We want to be able to sense gases, but we don’t want the sensor surface to get clogged down with particles and residue) and modified standard ABS enclosures with a dremel.
Voila!
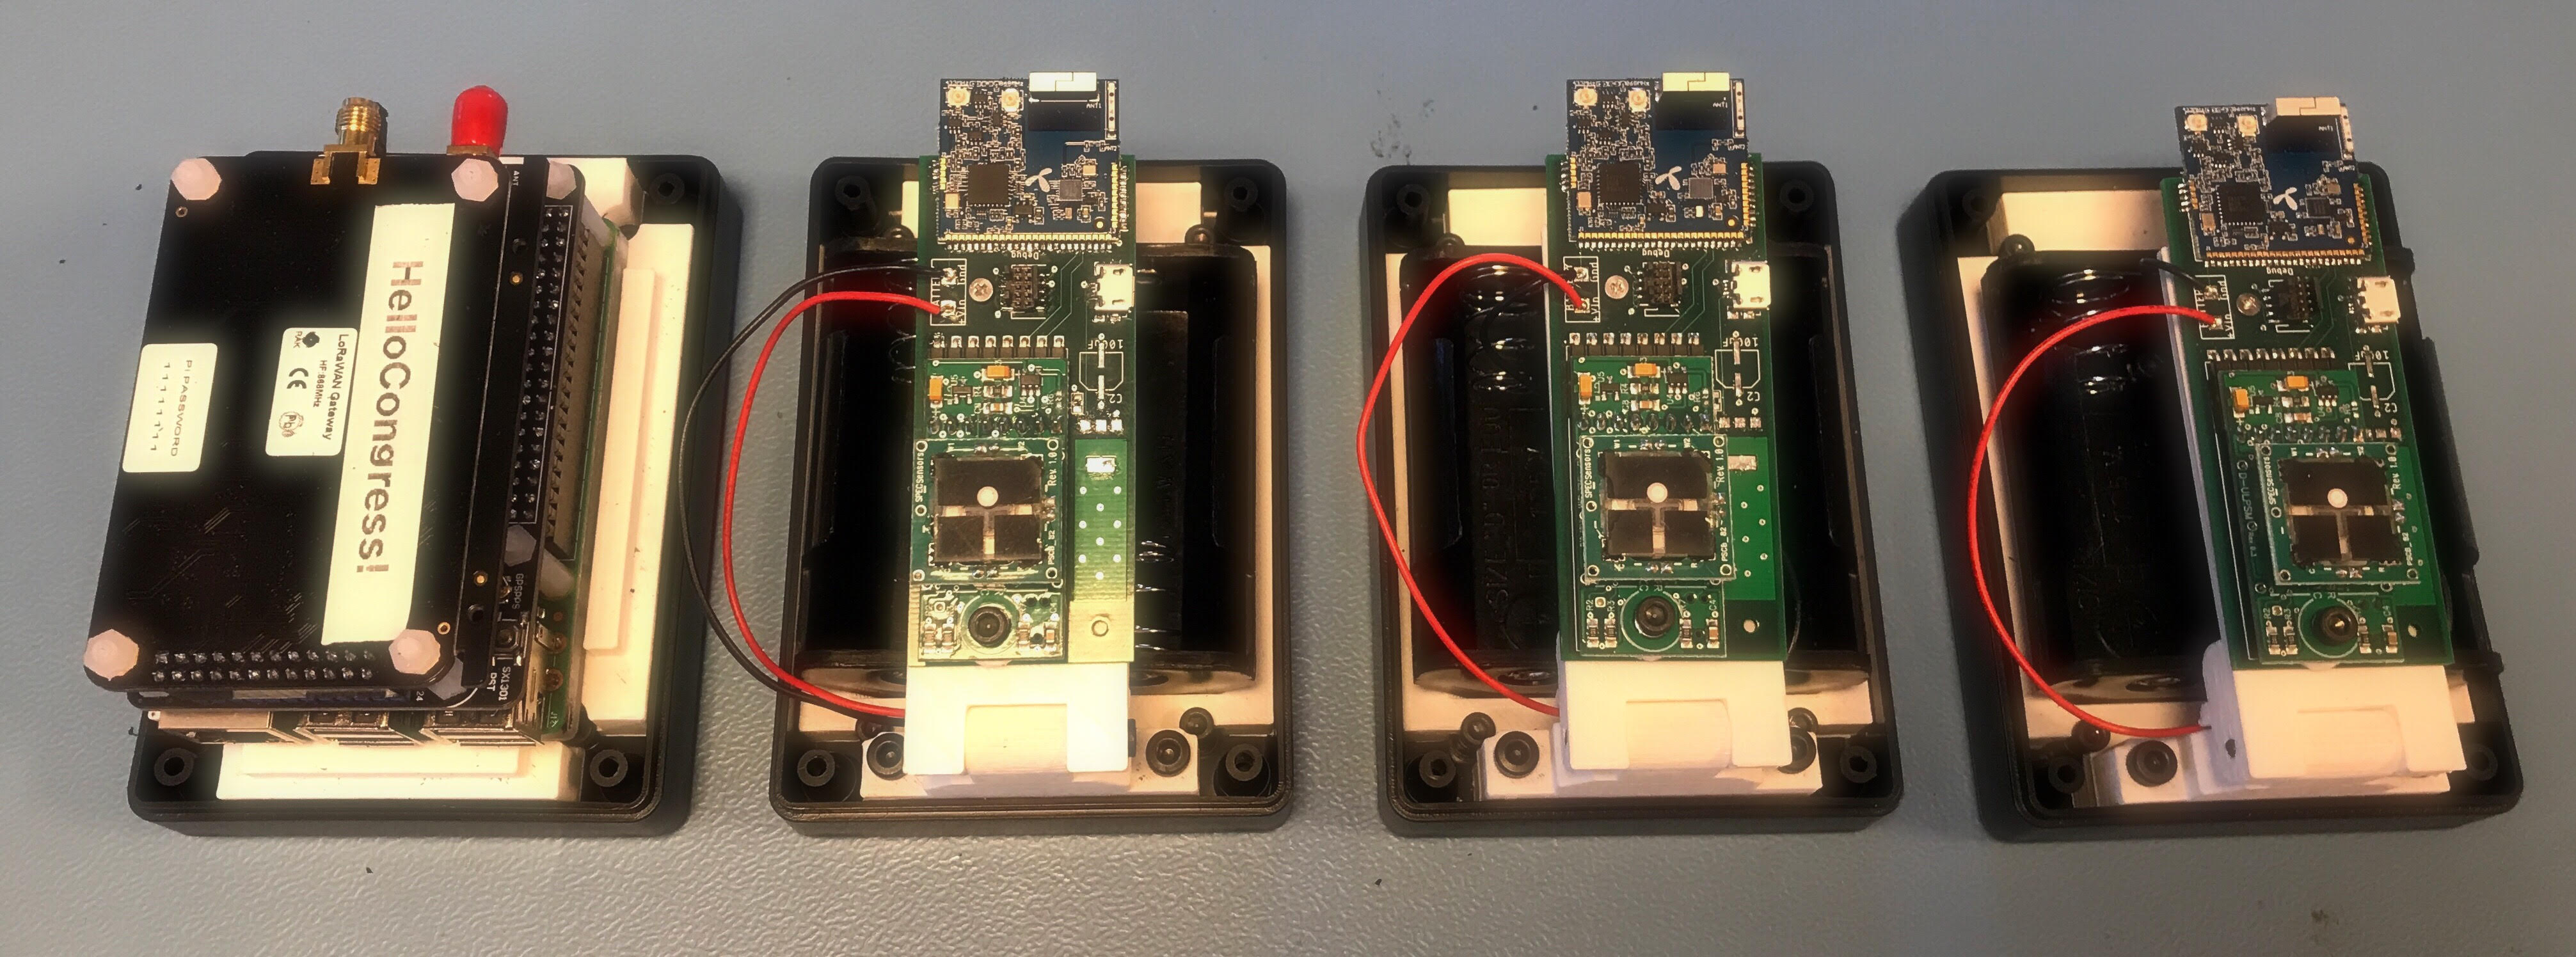
The white plastic is a 3D-printed part that bolts down the battery pack and sensor to the enclosure base. The leftmost enclosure contains a Raspberry Pi 3 and a RAK831 gateway module.
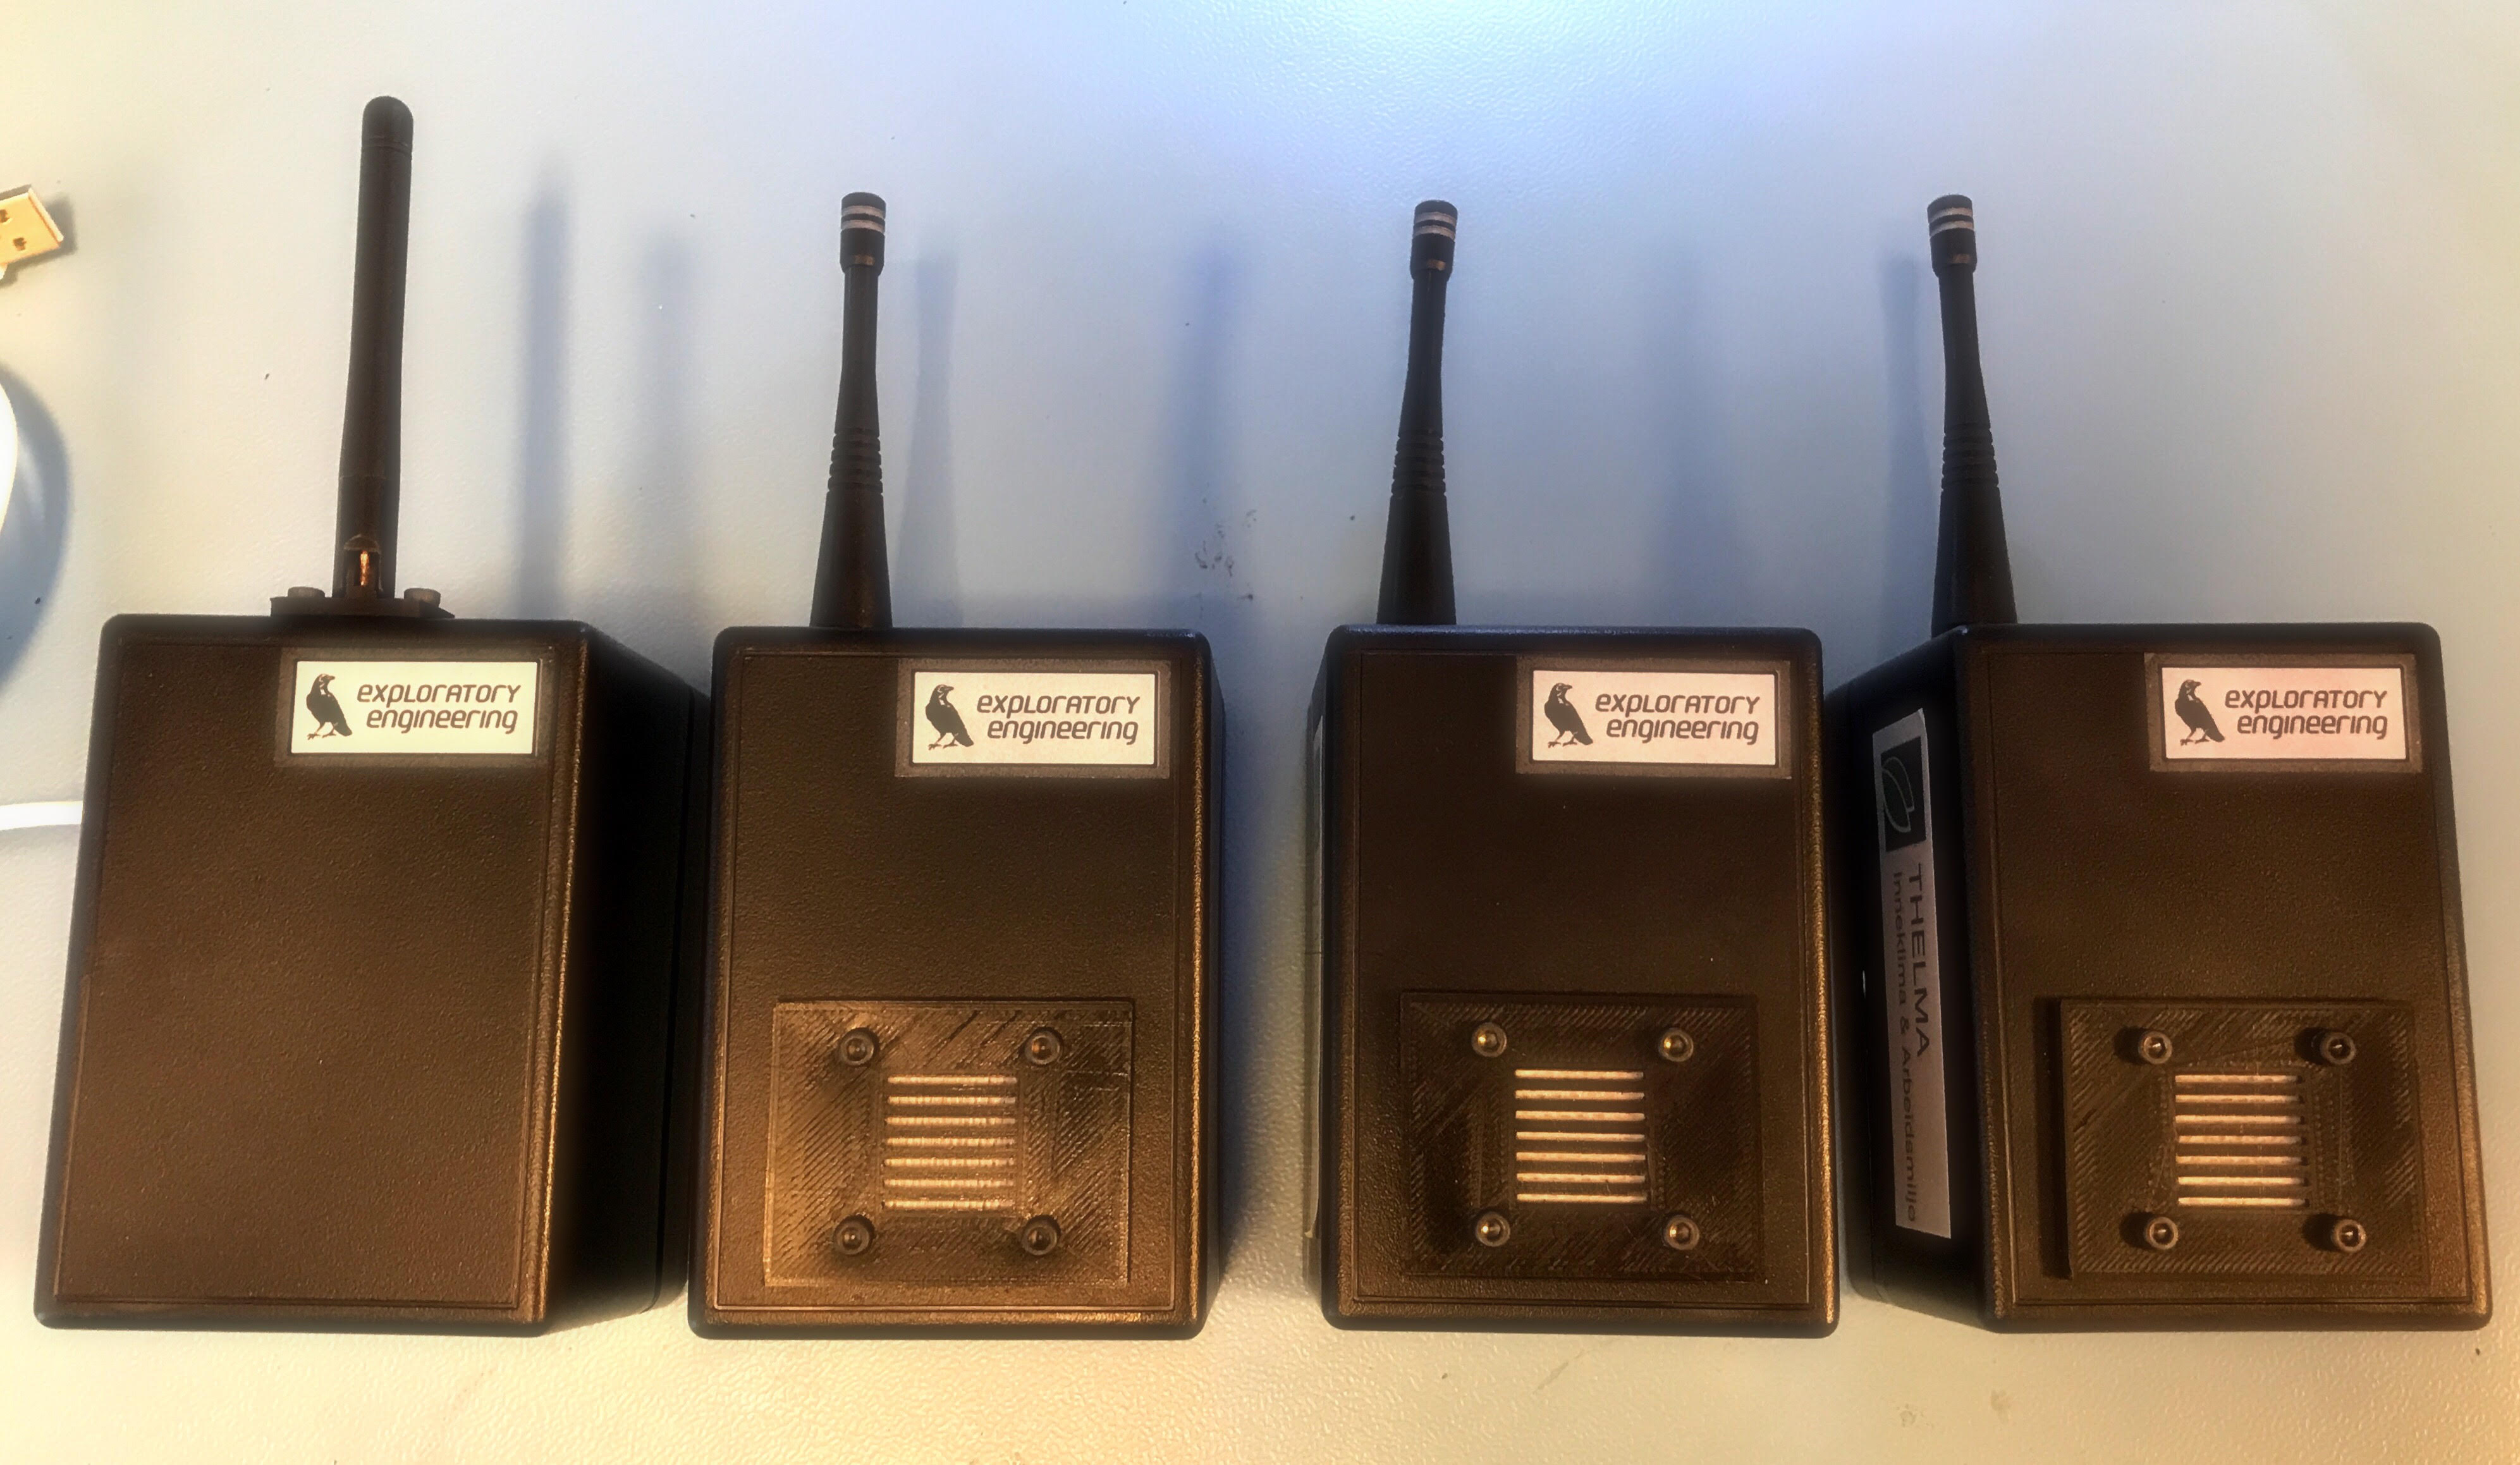
Finished enlosures, with HEPA filters installed and an external 868 antenna.
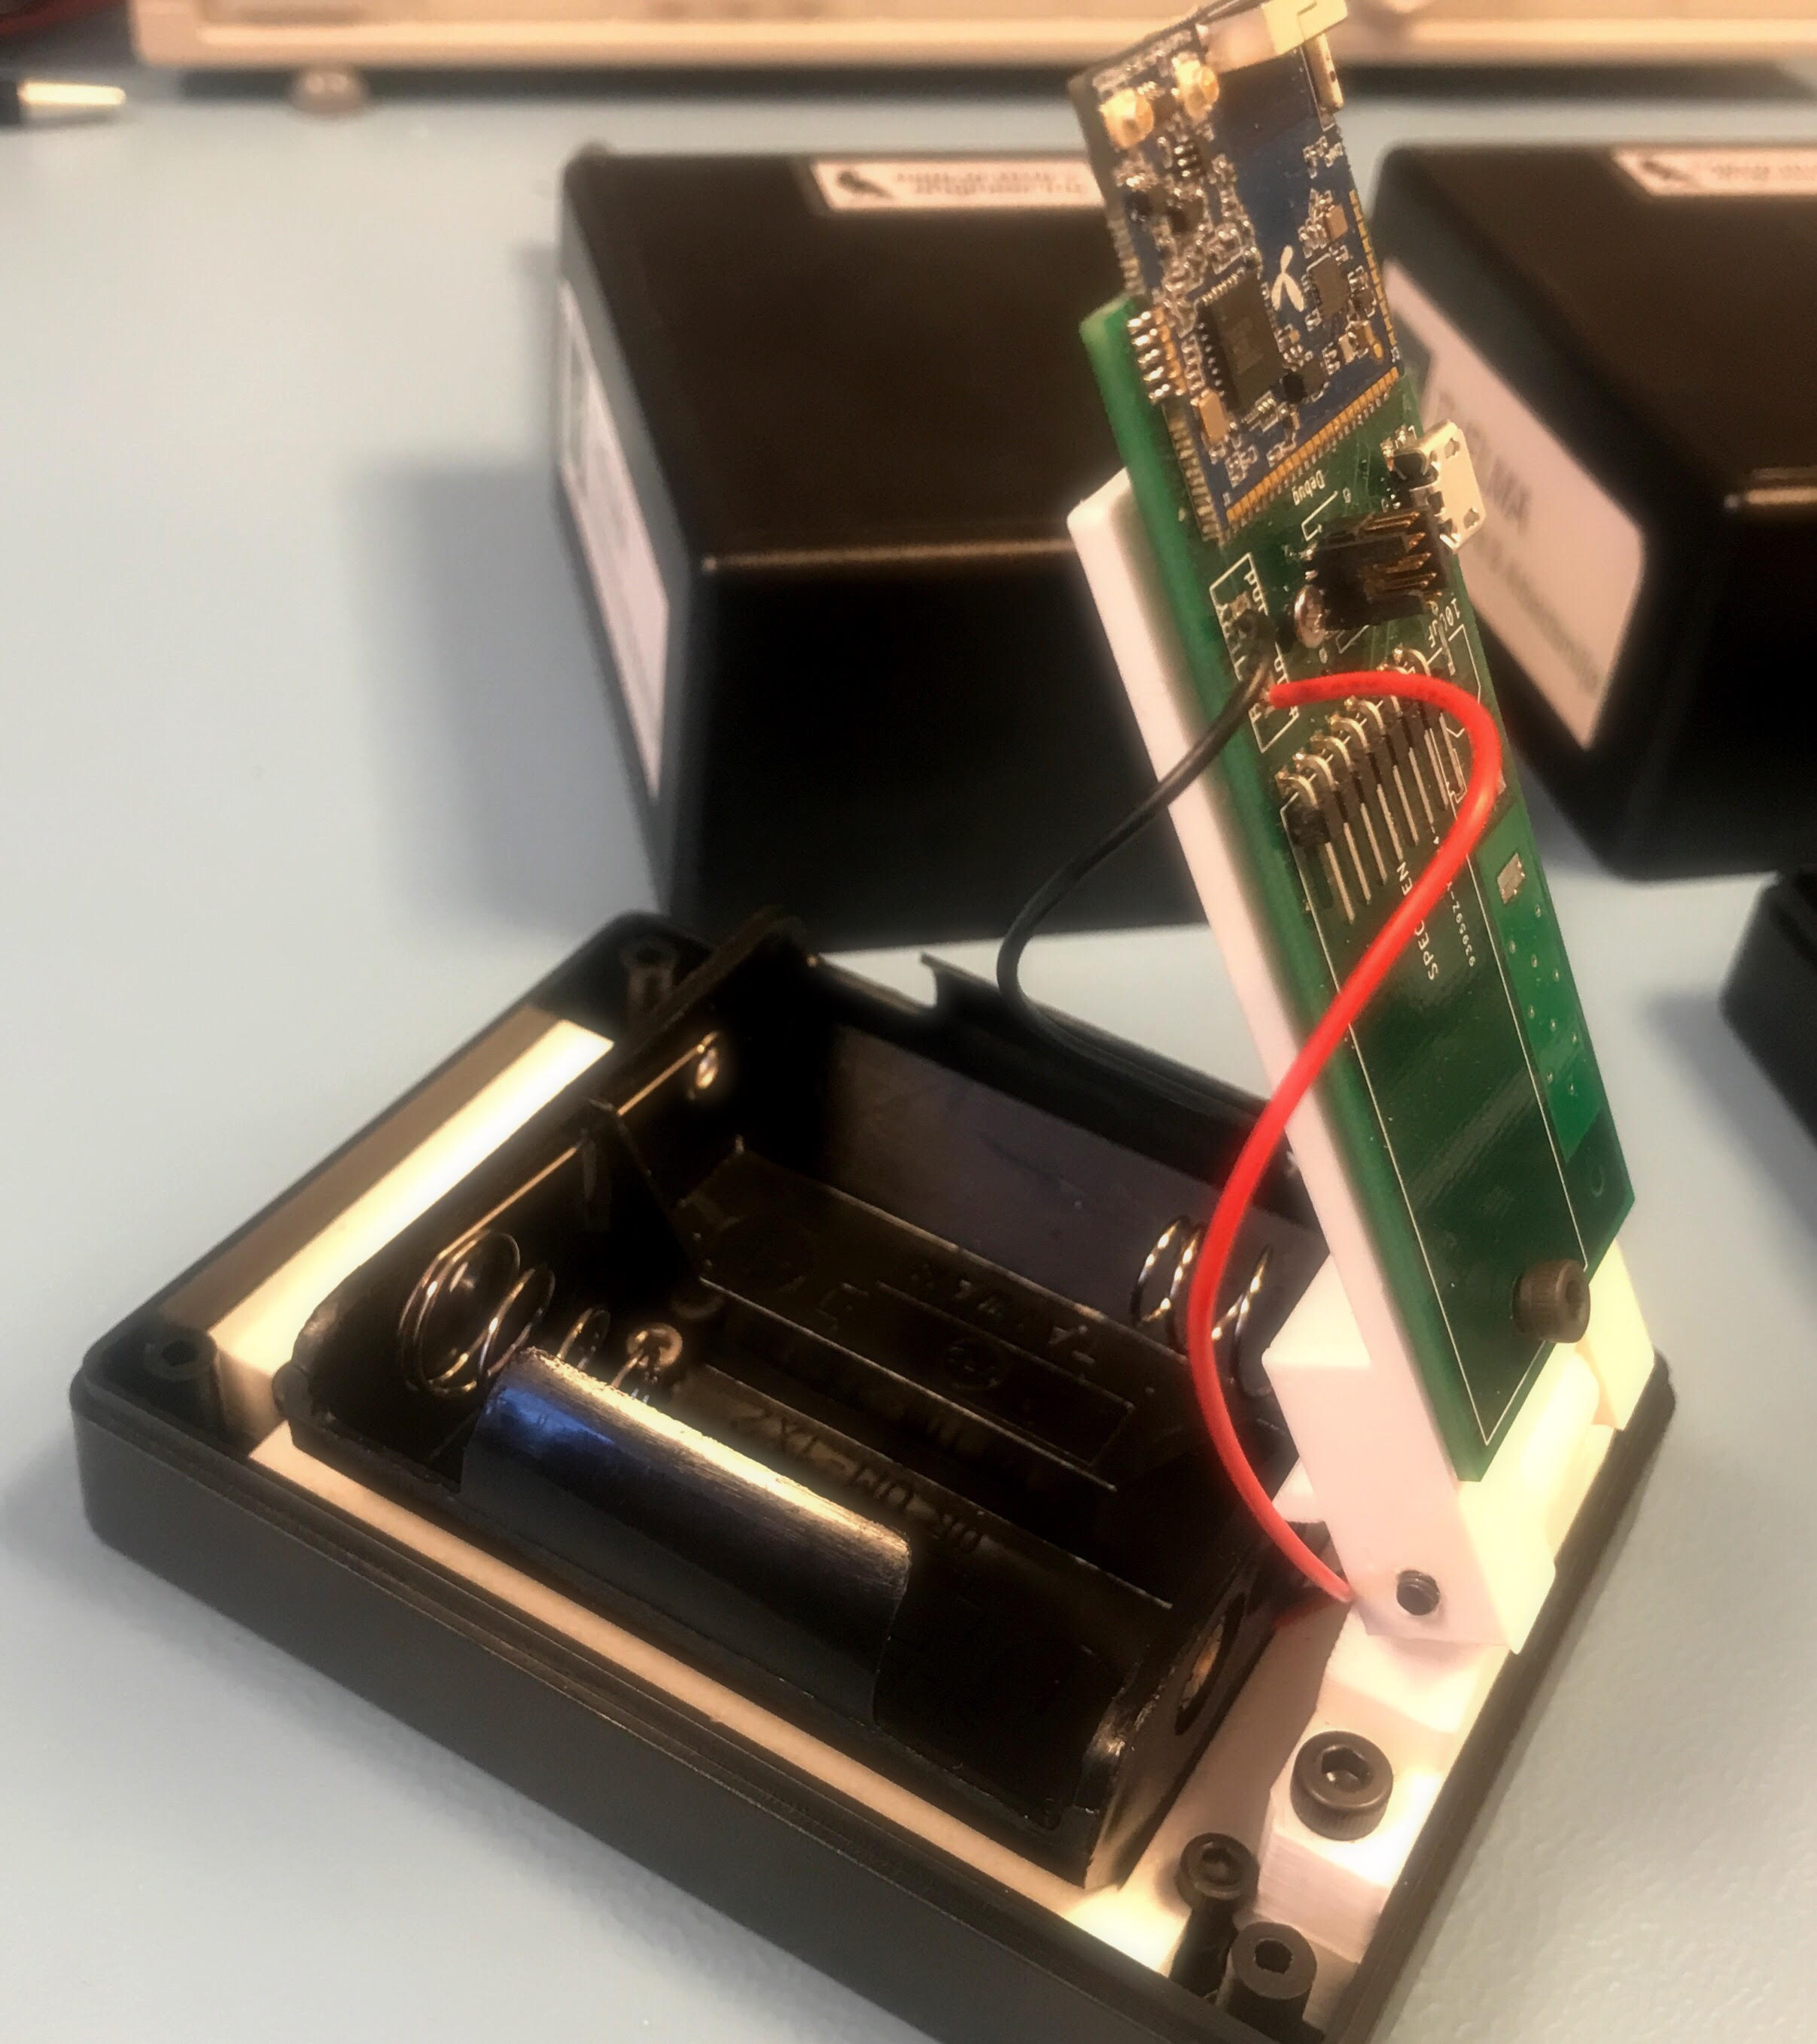
The sensor base can be tilted in order to facilitate easy battery replacement.
The joys of electrochemical sensors
The sensor data sheet indicates that the sensors have to stabilize in clean air for at least one hour before you can get correct readings from them. Having a plot of the sensor readings for the last 24 hours would be nice.
I have to admit that I was betting on this internet thing to quitetly go away, so I never bothered to learn “web stuff” - including Javascript. This turned out to be rather fortunate - for the rest of the guys in the Exploratory Engineering team. Having only experience with beautiful, statically typed languages, created by rational authors, my two day journey of pain in Javascript land turned out to be hugely enjoyable - for them. The process also helped in significantly extending their vocabulary.
function getSensorData(device) {
  var sensorData
  return $.ajax({
           url: "https://api.lora.telenor.io/applications/00-09-09-00-00-00-03-56/devices/" + device + "/data?limit=288",
           type: "GET",
           data: sensorData,
           headers: {
              "X-API-Token":<API token goes here ;)>
           },
            dataType: 'json',
        });
 }
(5 samples in each payload * 288 payloads == data for the last 24 hours)
On day two, the guys decided to end my suffering and tell me about how to use “$.when” in order to create a synchronization point that I could use to push data to ChartJS. (The guys attempted to tease me into using D3. Fortunately I managed to resist the temptation). The payload consists of 5 samples from each sensor, taken in one minute intervals. Each sample consists of a gas PPB reading, temperature and relative humidity.
Given the nature of analog sensors, you will not get a correct reading out of the box. The sensor has to stabilize in clean air. Readings from the sensor will be relative to the clean air reading. I could send a “Zero offset” command to the sensor, instructing it to use the current reading as a baseline for later readings, but since the sensors are rather noisy, I decided to instead use the lowest reading in a 24 hour period in clean air as bias for the zero offset.
Electrochemical sensors have a tendency to drift, so the excercise regarding offset calculation will have to be repeated at regular intervals. They also have a limited life span. This countdown starts immediately after the sensor having left the factory floor. Depending on the type of sensor, this lifespan can be as short as 12 months. After this time, the sensor will have to be replaced.
Anyways, I now had my visualization. The graph below shows the sensors stabilizing in (relatively) clean indoor air.
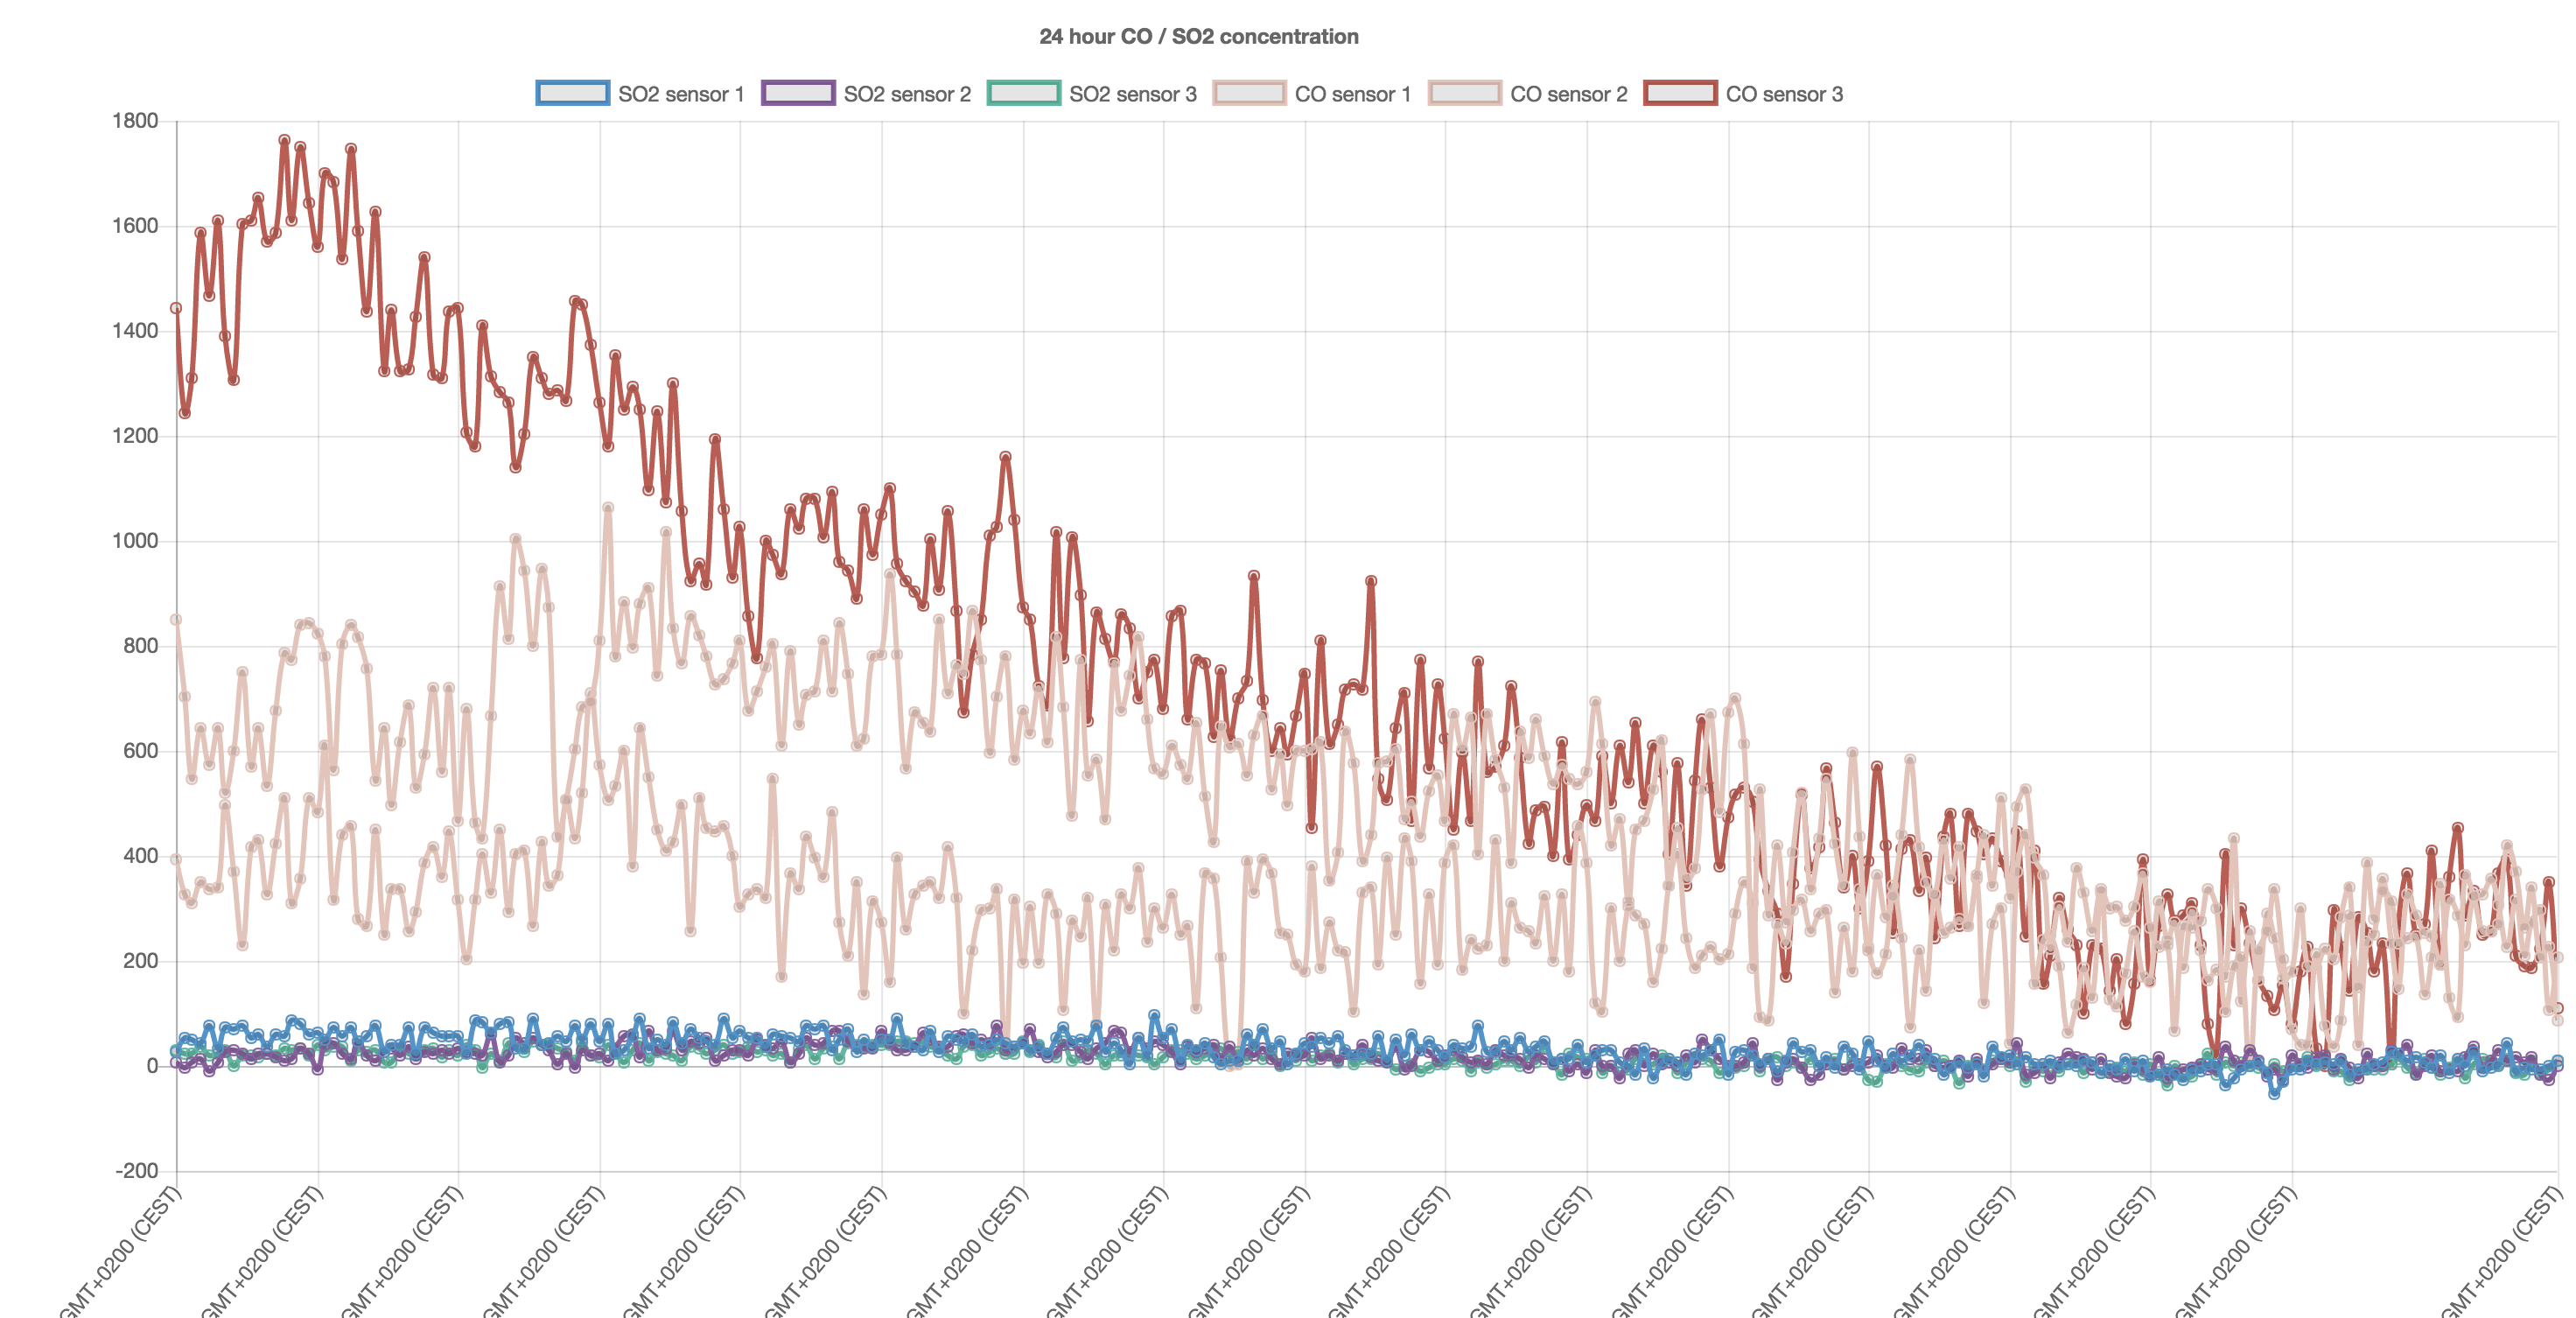
Gas concentration on the vertical axis is in PPB (Parts per billion).
These values are sampled in the office, assuming “reasonably” clean air. In cooperation with a company specializing in occupational hygiene (Thelma Inneklima og Arbeidsmiljø AS), these sensors are now deployed an industrial incineration facility nearby.It will be interesting to see how well the sensors perfom in an industrial environment, compared to more professional equipment.
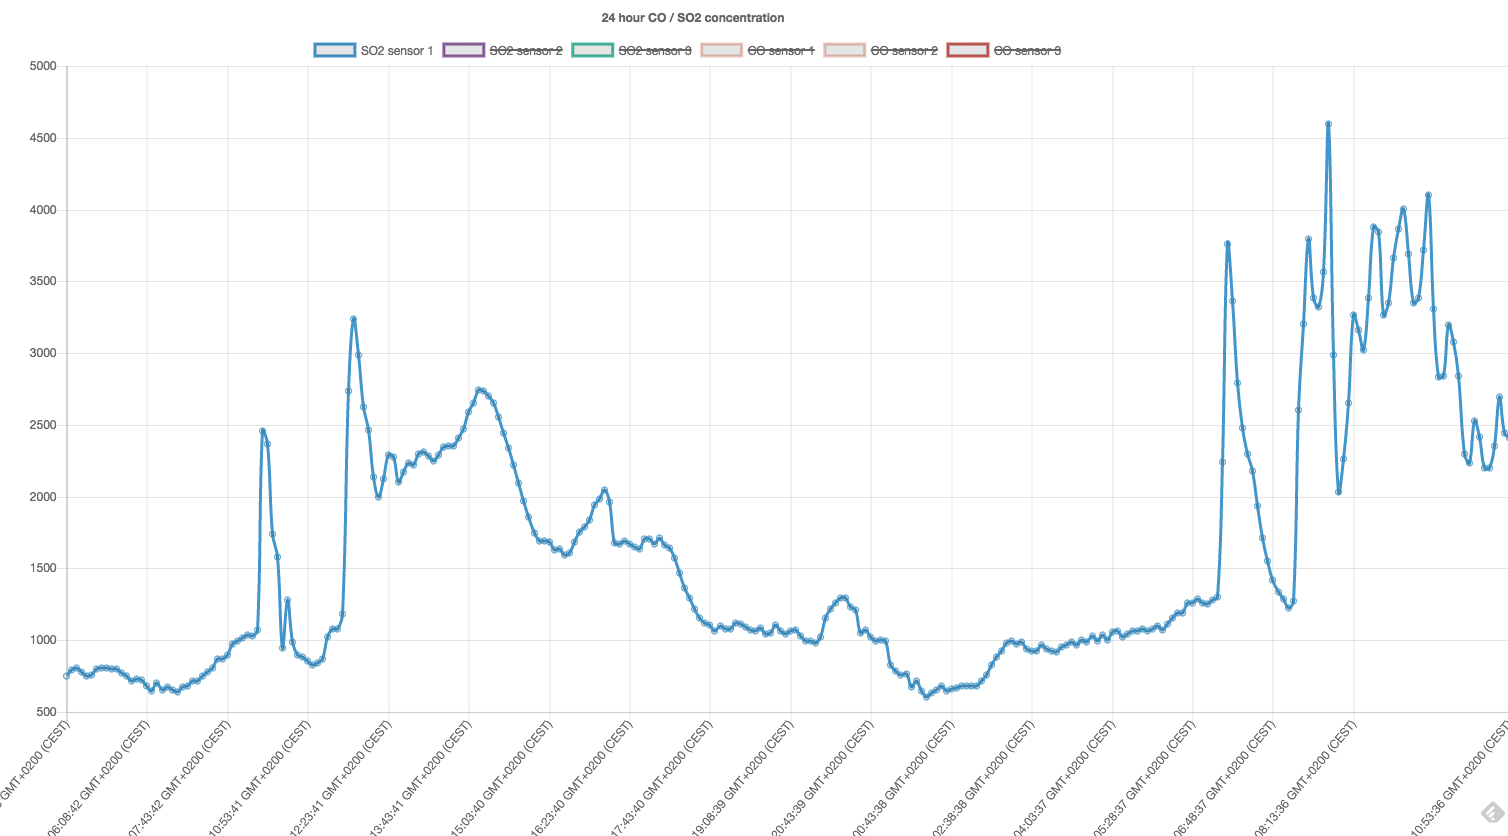
The graph below shows the sensor response for one of the SO2 sensors after deployment. It responds, and the levels are “sane”, but we will not know how well the sensors perform until we have compared the readings over a longer period of time, with readings from high end instrumentation that has been correctly calibrated.
Practicalities regarding new deployments
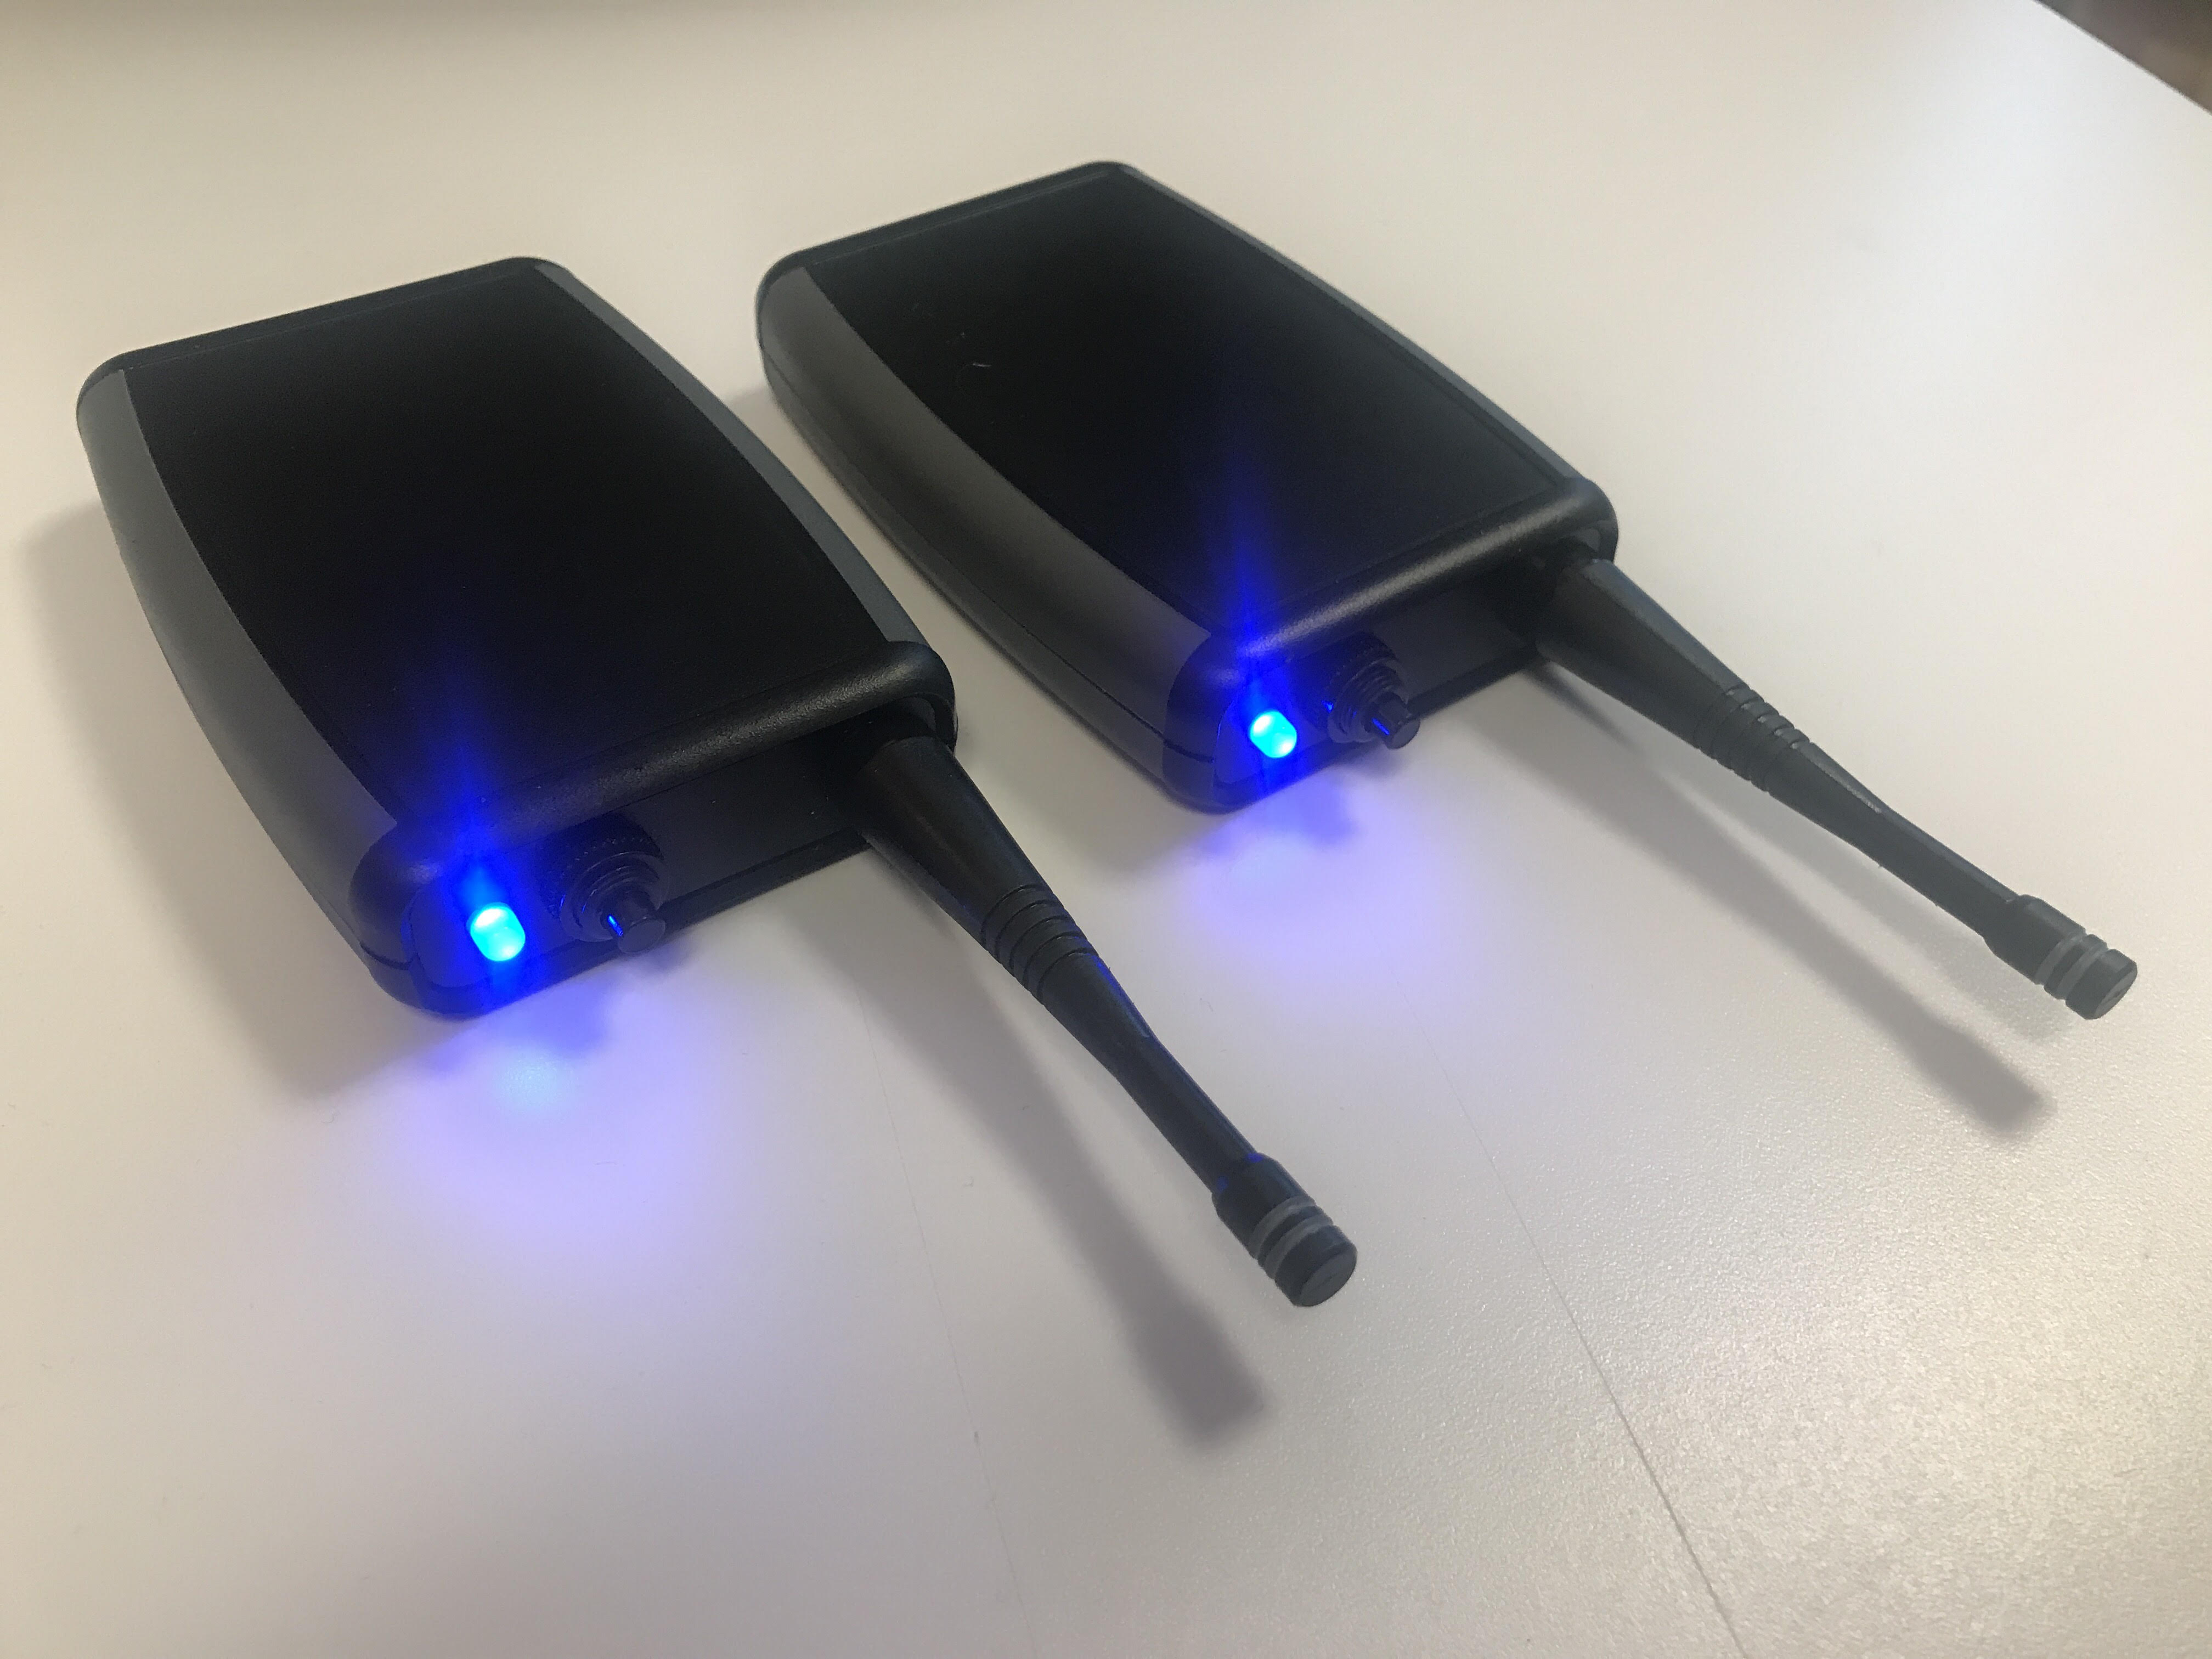
It turns out that some buildings come with natural faraday cages. In this case, one of the buildings was covered in steel panels - not a good environment for low power radio communication. I ended up making these little beauties in order to make it easier to decide on gateway / sensor placement. They basically implement the LoRA-ping demo example (sending LoRa packets between them). As long as they are within LoRa range of each other, the LED is lit. Once they are out of radio range, both LEDs go dark. This makes it really easy to find out if you will have LoRa coverage before starting to deploy IoT devices in an environment.