Integrated metrics
Trondheim, 2023-06-16
A new Span release with integrated metrics
This release of Span introduces metrics for organisations, collections, devices, firmware images and gateways. The metrics gives you an indication of the activity and traffic through Span and counts the number of bytes, and resources used.
This is the first version of the metrics and we only show the grand totals for each resource. The initial numbers are generated from the existing data and in particular the the gateway and data router metrics are all set to 0.
The next version of the metrics will have metrics divided into days, weeks and months which will make it easier to track the activity over time.
API Changes
There are no breaking changes in the API this time. The integrated metrics are generally available in a
separate resource named stats, ie. you can find the metrics for collection at /span/collections/{id}/stats
The returned JSON struct contains the aggregated metrics for the entire collection:
{
    "deviceCount": 12,
    "outputCount": 1,
    "firmwareCount": 3,
    "blobCount": 4,
    "gatewayCount": 1,
    "devices": {
        "bytesUpstreamMb": 12.24,
        "bytesDownstreamMb": 1.2,
        "messagesUpstream": 1224000000,
        "messagesDownstream": 120000000,
    },
    "outputs": {
        "forwardErrors": 100,
        "messagesForwarded": 224000000,
        "bytesForwardedMb": 2.24
    },
    "firmware": {
        "firmwareImageSize": 123456
    },
    "blobs": {
        "blobBytesMb": 1.456
    },
    "gateways": {
        "messagesUpstream": 10123,
        "messagesDownstream": 100,
        "bytesUpstreamMb": 0.003,
        "bytesDownstreamMb": 0.00001
    }
}
Note: The bytesUpstreamMb (messages from devices to the internet) and bytesDownstreamMb (messages sent to the devices) are all given as MiB, ie multiply with 1024*1024 to get the number of bytes. JSON and JavaScript does not handle numeric values above 2^32 very gracefully.
If you look at the metrics for a single it will only show the metrics for that device:
{
    "bytesUpstreamMb": 1.24,
    "bytesDownstreamMb": 0.12,
    "messagesUpstream": 122400000,
    "messagesDownstream": 12000000,
}
Front end changes
If you click on an organisation, collection, device, gateway or data router in the frontend you’ll see a new section with the metrics.
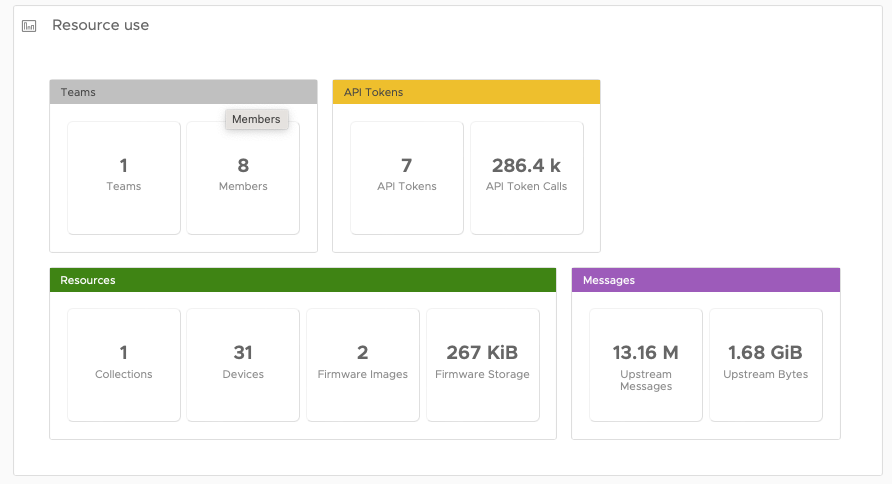
Bytes are counted in KiB, MiB and GiB while numbers uses SI suffixes (k, M, G).
The list of metrics shown will vary depending on what resource you are looking at, just like the API calls above.
As always the API documentation is at https://span.lab5e.com/span/docs/ and the orgs, teams, tokens and user API documentation is available at https://span.lab5e.com/dejavu/docs/
If you want to generate your own OpenAPI client specss are available at http://span.lab5e.com/span/docs/api.json and http://span.lab5e.com/dejavu/docs/api.json.